The FinOps tip: Limit the verbosity of your Azure Functions
Setting up the monitoring of your Azure Function is essential (especially for your applications in production). But it happens that these produce many more logs than necessary. In this case, you can have a significant financial impact on Application Insights/Log Analytics. Here are some tips to limit this.
Monitor log volumes
In order to understand why your log ingestion costs are exploding on Application Insights/Log Analytics, you need to identify the most common types of logs. From Log Analytics run the following Kusto query:
union *
| where timestamp > ago(7d)
| summarize sum(_BilledSize) by itemType
| render piechart
This query generates a pie chart with the distribution of the volume of billable logs by type of logs.
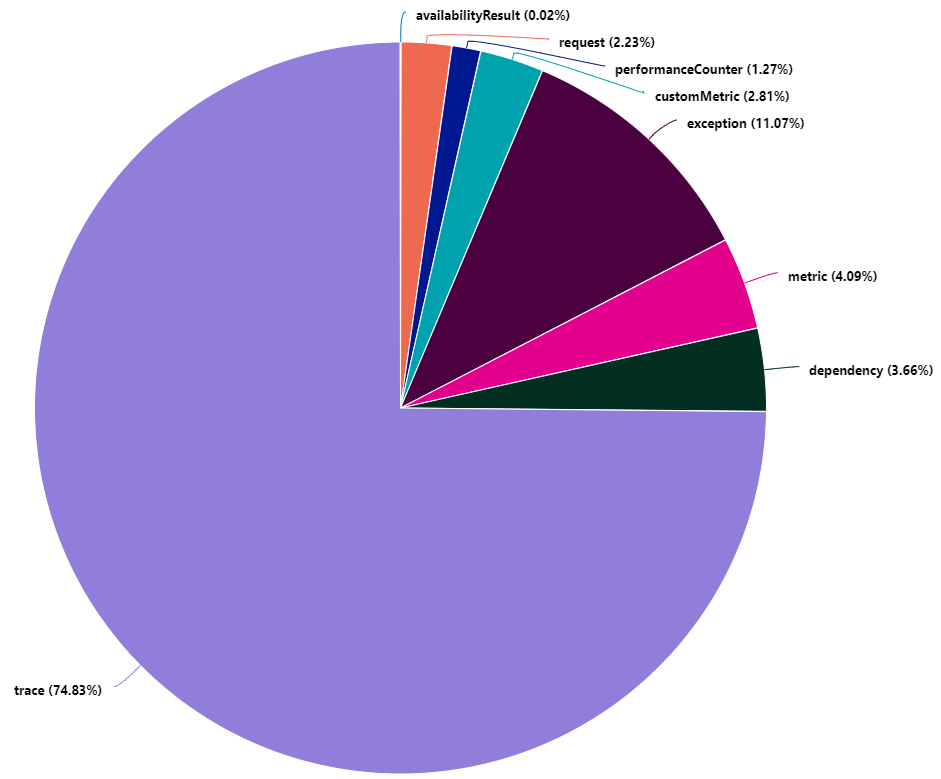
In this example, we can see that trace type logs represent more than 74% of the volume of billable logs.
Let's focus on these trace logs to now identify which sources are producing the most volume. Maybe a particular application generates too many logs. From Log Analytics now run the following Kusto query:
traces
| where timestamp > ago(7d)
| summarize sum(_BilledSize) by cloud_RoleName
| render piechart
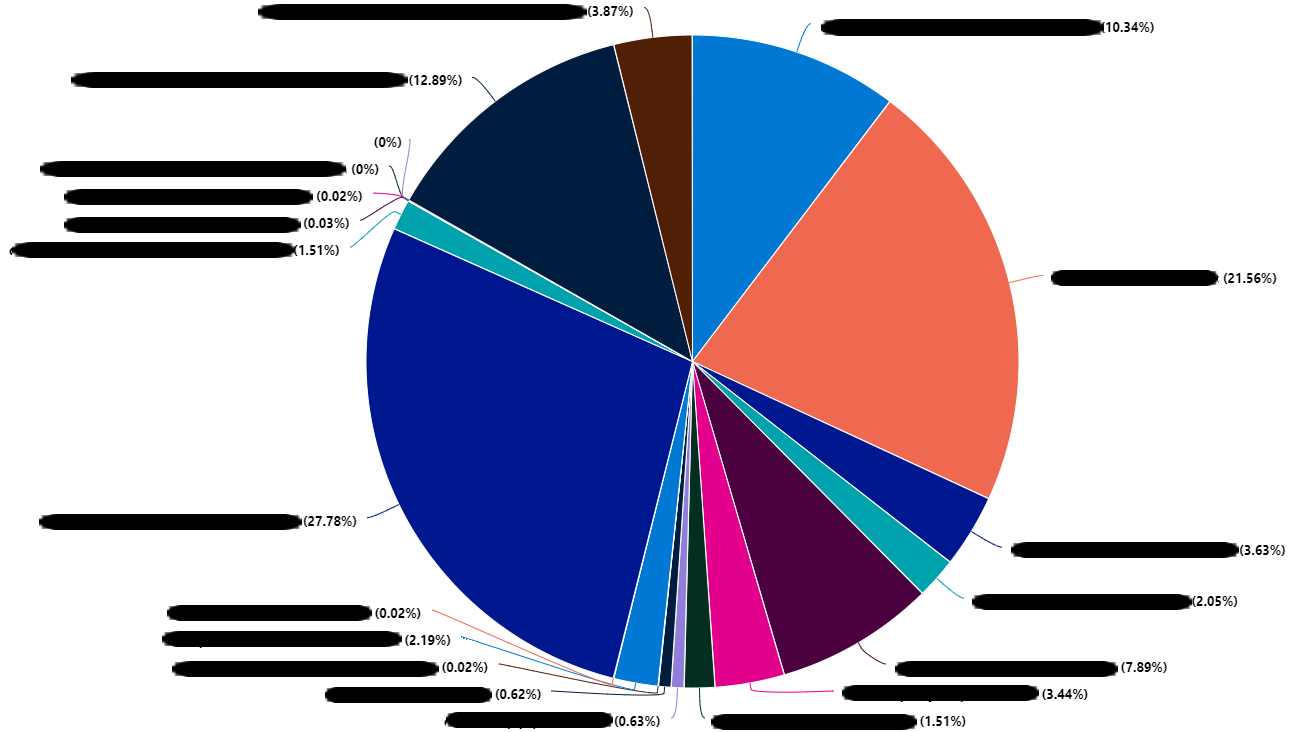
In the example above, we see that the sources of our logs are varied and rather distributed. This is not always the right track!
If this is not one of the sources at the origin of our volume of logs, perhaps it is a library, an SDK used by our Azure Function which is the source of our misfortunes.
Note
The Azure Function runtime classifies logs by category. These category are accessible in the customDimensions of the trace logs.
To do this, we will execute the following Kusto query:
traces
| where timestamp > ago(7d)
| summarize sum(_BilledSize) by tostring(customDimensions.Category)
| render piechart
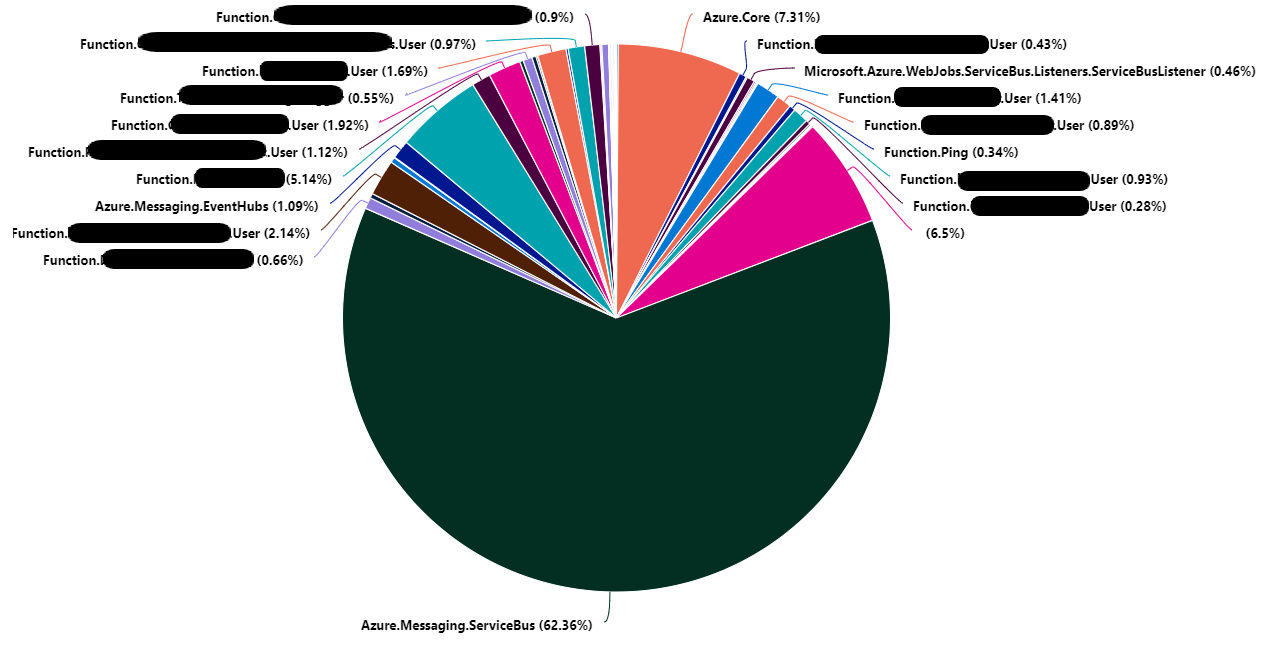
In the example above it appears that the category Azure.Messaging.ServiceBus represents 62% of the volume of trace logs. Reduced to the total volume of logs, this represents: 46.5%.
Now that we have identified our origin. It is necessary to ensure the relevance of the logs. Maybe these logs are needed? A simple exploration of the logs over the last 30 minutes (or more depending on your context) allows you to quickly analyze the logs:
traces
| where timestamp > ago(30m) and customDimensions.Category == "Azure.Messaging.ServiceBus"
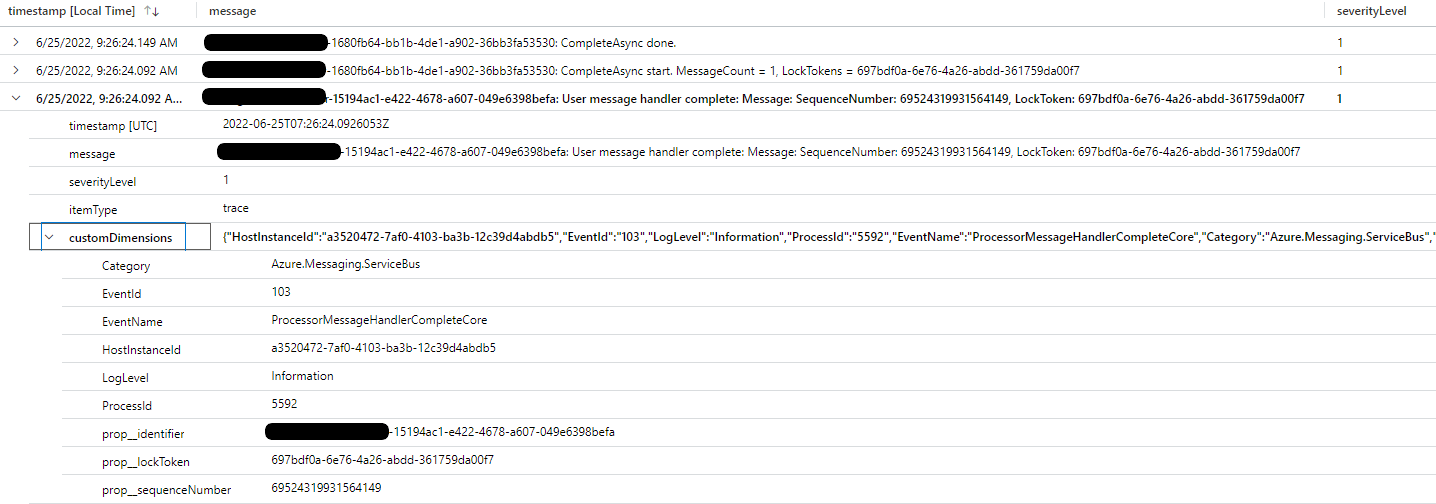
In our case, we see that these are logs allowing us to trace the sending and reception of messages to and from Azure ServiceBus.
We consider that these logs are not relevant (simple assumption, it is not a generality). These logs can be removed from Azure Application Insights/Log Analytics ingestion. But before intervening it is necessary to check the distribution of these logs by severity level.
For this, the following Kusto query will help us:
traces
| where timestamp > ago(30m) and customDimensions.Category == "Azure.Messaging.ServiceBus"
| summarize count() by tostring(customDimensions.LogLevel)
| render piechart
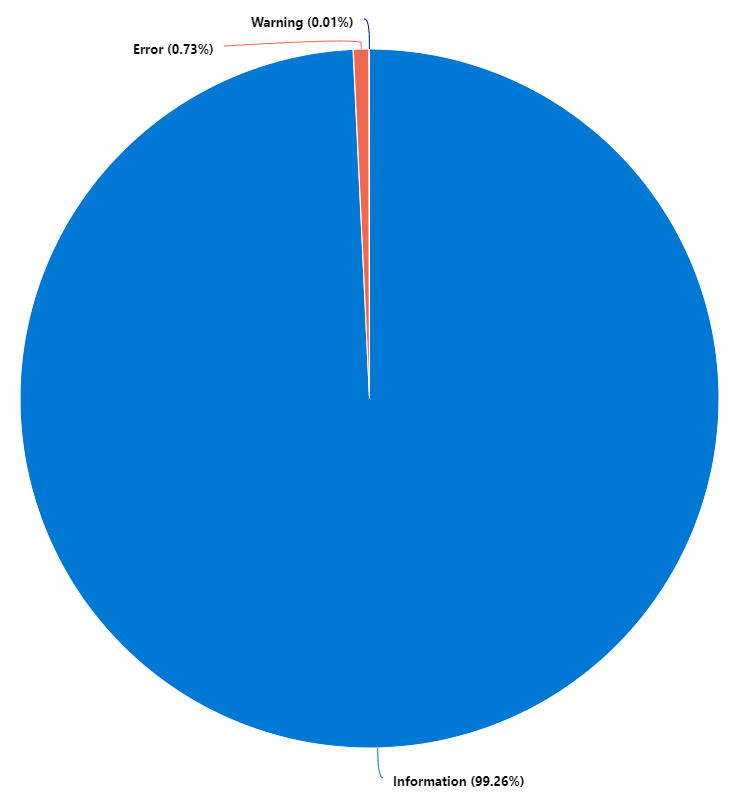
It can be seen that 99% of the logs are of the Information severity level.
This analysis process shows that a simple remediation at the Azure Function configuration level will reduce the volume of logs by 46%. This remediation consists of raising the verbosity level to Warning for the logs of the Azure.Messaging.ServiceBus category.
Remediation at the Azure Function level
I won't explain how to configure your Azure function so that it can send its logs to Application Insights. This Microsoft article explains it very well.
However, what this documentation does not explain well is that the list of categories described here is not exhaustive.
Indeed, all the categories previously identified during the analysis can be configured.
To raise the verbosity level to Warning for logs in the Azure.Messaging.ServiceBus category, simply modify the host.json file by adding "Azure.Messaging.ServiceBus": "Warning" .
We will have a file that will look like this:
{
  "logging": {
    "logLevel": {
      "default": "Information",
      "Azure.Messaging.ServiceBus": "Warning"
    }
  }
}
And that's all !
Conclusion
It is important to take the time to analyze the nature of the logs. The Application Insights and Log Analytics services offer excellent means of analysis and research. In a FinOps approach, they can prove to be very practical tools. Indeed, through this example I managed to reduce by 46% the volume of logs ingested by Application Insights/Log Analytics. Assuming that we had 10 GB of logs ingested per day (in the France Central region), this would amount to a saving of €350 per month.
References
- Microsoft : How to configure monitoring for Azure Functions
- azure-sdk-for-net - issue : [QUERY] Service bus telemetry seems excessive
Thanks
- Nicolas Bregent : for proofreading
- Fabrice Weinling : for proofreading
- Etienne Louise : for proofreading
- Samy Mameri : for proofreading
Written by Philippe MORISSEAU, Published on June 27, 2022.